
Monitoring Elasticsearch using Zabbix and… Elasticsearch part 1
At Infi we regularly use Elasticsearch either as a search engine for content, or as a target for storing log messages generated by our code bases. Elasticsearch, however, is by itself already a complicated product and requires careful monitoring to make sure it keeps performing well.
In this 4-part blog post series I describe 4 methods you can use to monitor Elasticsearch:
- Query and index request latency with nginx and filebeat.
- Put latency metrics into Zabbix so you can set alerts.
- JVM stats such as GC information using JMX.
- ES Node and cluster state using ES native monitoring endpoints.
We mostly use Zabbix for data collection, metrics storage and alerting, but I guess most ideas translate to other monitoring tools as well. In some instances I will provide Zabbix-specific examples and code though. Also, I won’t be interpreting the data too much in these posts, for info about how Elasticsearch works internally I can refer you to Elasticsearch: The Definitive Guide or Datadog’s guidance on monitoring ES with Datadog.
In the examples I’ll assume you’re on Ubuntu 18.04, using stock packages for all components. Things should translate fairly easily to other distros though, let me know if you have any problems though.
Query and index request latency with nginx and filebeat
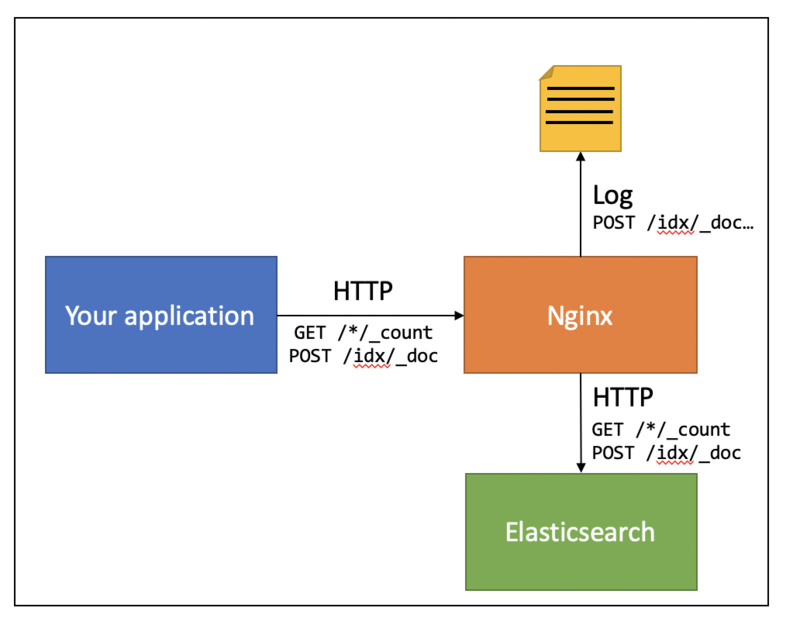
A key indicator of Elasticsearch health is how fast it is to index or query documents. As Datadog’s article points out, Elasticsearch currently does not expose a native endpoint where it provides this sort of information. This means we have to get a bit creative. Luckily, we can leverage the fact that all communication with Elasticsearch is done through an HTTP API (unless you use the now deprecated TransportClient API on Java) by injecting an HTTP proxy between clients and Elasticsearch:
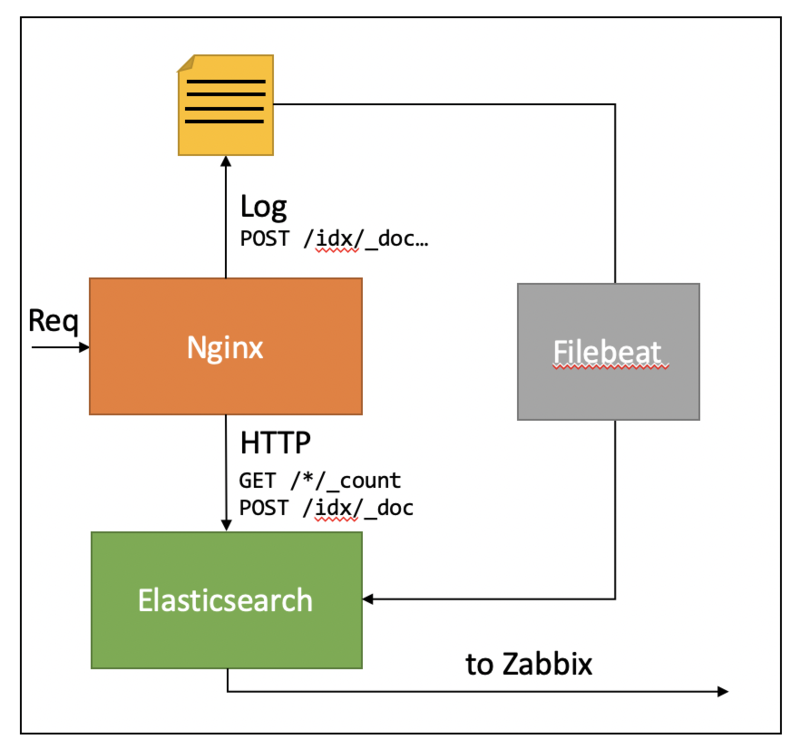
Now, if this HTTP proxy is capable of logging request times, we can obtain the response times from the HTTP proxy access logs:
The goal of this post is to walk you through the details.
Injecting an HTTP proxy
When talking about HTTP proxies, Nginx is the de facto standard. It’s also extremely easy to setup, so we’ll use that in this post.
The first decision we need to make is which port we’ll use for Nginx and which one we use for Elasticsearch. By default, Elasticsearch runs on port 9200, which means that if we use that for Nginx, we don’t need to change any clients. On the other hand, you might want to be explicit about which clients you want to monitor, and which clients you don’t. For example, I don’t monitor Kibana and Filebeat queries myself – they generate too much noise. In this example, we’ll run nginx on 9200 and Elasticsearch on 9201.
Rebind Elastisearch to port 9201
Edit /etc/elasticsearch/elasticsearch.yml with your favorite editor and change the line:
#http.port: 9200
to:
http.port: 9201
and restart Elasticsearch: systemctl restart elasticsearch.
Install and configure Nginx for proxying
Use apt to install nginx:
apt-get install nginx
Change the default site config in /etc/nginx/sites-enabled/default to:
Reload nginx to effect the changes:
systemctl reload nginx
If you now query Elasticsearch on port 9200, you’ll notice that it returns the familiar “You know, for search…” tagline, but it’s now being served through nginx as indicated by the Server header:
Congratulations! Elasticsearch is now being served through Nginx. The next step is collecting the timing information in the logs.
Add timing information to the logs
By default, nginx uses the combined logging format. This results in access log entries such as the following:
While there is some nice data in there, it always befuddles me that the request timing is not in there by default. Fortunately, we can define our own log formats. Create a new file /etc/nginx/conf.d/log_format_upstream_time.conf:
This is simply the combined log format, with some additional fields:
$request_time
this is the total request time as seen by nginx
$upstream_response_time
total time spent waiting on Elasticsearch
$upstream_connect_time
the time taken to connect to the Elasticsearch server
$upstream_header_time
time spent receiving the response header
We’re mostly interested in $request_time, but the other fields may come in handy when we need to debug any problems.
With this log_format created, we now need to use it. Alter /etc/nginx/sites-enabled/default to the following:
Of course, you can change the log location to anywhere you please. I recommend using the .access.upstream_time.log extension though, since this makes it easier to select the correct files in the filebeat config later on.
Again, reload nginx:
systemctl reload nginx
Now, if you make another request, the timings should be logged to the access log:
Congratulations! You’re now collecting timing information on your Elasticsearch queries. In the next step, we use Filebeat to feed back this data into Elasticsearch so that we can actually query and visualize it.
Feed back response time data into Elasticsearch
Normally, you use Filebeat to ship log files into Elasticsearch. Filebeat even comes with an nginx module which can automatically send nginx access and error logs to Elasticsearch. This module assumes the default (combined) access log format though, which means we can’t use this to get our response time data into Elasticsearch.
What’s interesting about this module though, is that it comes with an Elasticsearch pipeline definition for parsing the combined log format. Since our custom format is just an addition to this format, we can leverage this pipeline definition to do the work of parsing the initial part of the log entries. To do this, we first need to install the pipeline definitions (make sure filebeat is already installed):
filebeat -e setup --pipelines --modules nginx
If everything went well, the pipelines will now be installed. You can check using:
This means the pipeline for the access file has been registered as filebeat-6.3.2-nginx-access-default. Note this is a somewhat older version (even at the time of writing), due to me using the -oss releases of the elastic toolset.
We can now create a pipeline for parsing our custom fields in the upstream_time log format:
Be sure to replace filebeat-6.3.2-nginx-access-default with the value obtained when verifying earlier. Note that this pipeline also records the original message under the log_line field. You can safely remove this if you don’t need it. The pipeline has now been installed, and we can now setup filebeat to send the log to Elasticsearch by using this pipeline. To do that edit /etc/filebeat/filebeat.yml and add an input to the config:
The complete filebeat.inputs section of the config should then look something like this (excluding comments):
Note that we specifiy the nginx-response-time pipeline which must be the same name as we used to create the pipeline earlier.
Start filebeat to start collecting the data:
systemctl start filebeat
Your log data should now be getting indexed:
We can nicely see all the fields being there, and parsed as float. Note that the filebeat index by defaults starts with filebeat- and by default rolls over after one day. You can change this in the filebeat.yml config file.
Congratulations! You now have the request times nicely available in Elasticsearch. The next step is visualizing this in Kibana.
Note:
When you configure filebeat to talk to nginx instead of directly to Elasticsearch, you’ll end up with a positive feedback loop since every insert by Filebeat will result in another entry in the access log.
This won’t kill you system since by default, Filebeat will only flush its buffers once every second, so this will at most generate 86400 entries per day. Still something you might not want though.
Visualize latencies percentiles in Kibana
Now that we have our data available in Kibana, we can use all the cool toys from Kibana to visualize what’s going on. What you need to see depends a bit on your usage, in my project I use the POST /<index-name>/_doc API to index documents, and have a GET /<index-name>/_count query that I run often. If you use different API endpoints (e.g. GET /*/_search), it makes sense to monitor those.
If we just open the index in Kibana’s Discover, and select the nginx.access.url and nginx.access.request_time fields, we get something like this:
We can also filter for slow requests, by setting the query to nginx.access.request_time:[0.1 TO *]. This will show all requests that took longer than 100ms:
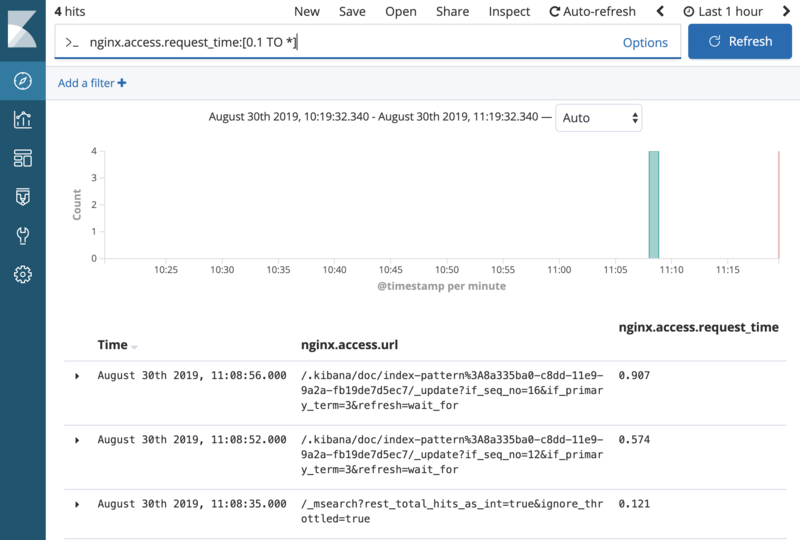
This can already be very useful to debug slow queries.
For monitoring purposes, however, we’d like to have a broader perspective. For that we can use the Percentiles aggregation to show which percentage of requests fall within a given request time.
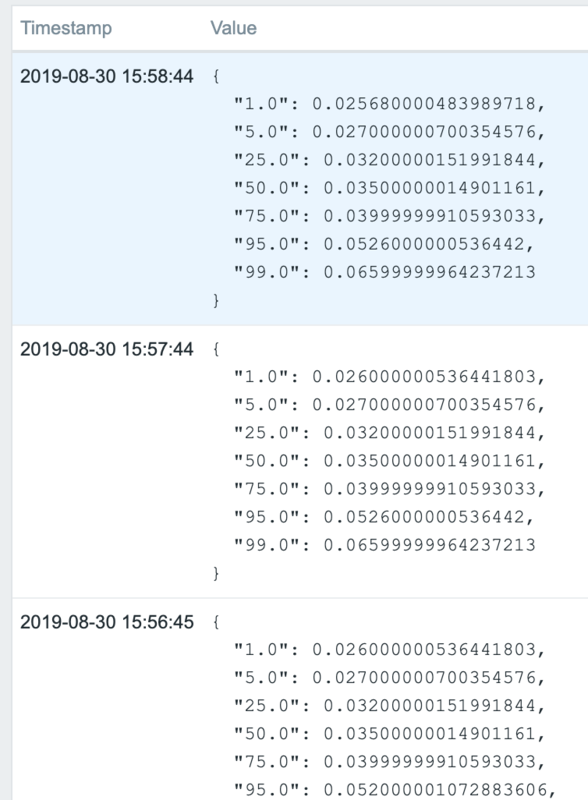
This shows the request time distribution for our _count queries. As you can see, 95% of all requests are being served under 60ms, while 99% of all requests are served under 100ms (except for the peak at around 10am). This gives a better picture than measuring, for example, just the average, since outliers can indicate problems and – when this corresponds to an end user search – a bad experience for the user.
If you want to use this visualization for yourself, get the export here.
Of course, there’s much more you can do with Kibana to explore this data, and I highly encourage you to do so!
Conclusion
In this post I’ve shown how you can use Nginx to collect performance metrics about high level Elasticsearch operations, such as indexing a document or performing a search. With this data in hand, you can get a good indication of how well (or bad) you Elasticsearch cluster is performing.
Unfortunately, at this point you can only monitor that information by hand. In the next post, I’ll show you how you can put that data into Zabbix so that you can set triggers and get notified when something goes wrong.