
Monitoring Elasticsearch using Zabbix and… Elasticsearch part 2
At Infi we regularly use Elasticsearch either as a search engine for content, or as a target for storing log messages generated by our code bases. Elasticsearch, however, is by itself already a complicated product and requires careful monitoring to make sure it keeps performing well.
In this 4-part blog post series I describe 4 methods you can use to monitor Elasticsearch:
- Query and index request latency with nginx and filebeat.
- Put latency metrics into Zabbix so you can set alerts.
- JVM stats such as GC information using JMX.
- ES Node and cluster state using ES native monitoring endpoints.
We mostly use Zabbix for data collection, metrics storage and alerting, but I guess most ideas translate to other monitoring tools as well. In some instances I will provide Zabbix-specific examples and code though. Also, I won’t be interpreting the data too much in these posts, for info about how Elasticsearch works internally I can refer you to Elasticsearch: The Definitive Guide or Datadog’s guidance on monitoring ES with Datadog.
In the examples I’ll assume you’re on Ubuntu 18.04, using stock packages for all components. Things should translate fairly easily to other distros though, let me know if you have any problems though.
Monitoring Elasticsearch request latencies with Zabbix
In the previous part of this series, I explained how you can use Nginx logging to monitor request latencies and put that data into Elasticsearch. At Infi, we use Zabbix for storing our monitoring data and putting alerts on them, so having the data in Elasticsearch is not enough for us. Instead, we’ll use Zabbix UserParameters to query Elasticsearch and collect the data in Zabbix.
Note:
While this post is written in the context of monitoring Elasticsearch, you can actually use this (and part of the last post) for any HTTP request latency monitoring you’d like to do. So if you’d like to monitor the latencies of your website, you can use the exact same strategy.
As a recap, in the last post we ended with this situation (except for the to Zabbix step, which is obviously the goal of this post):
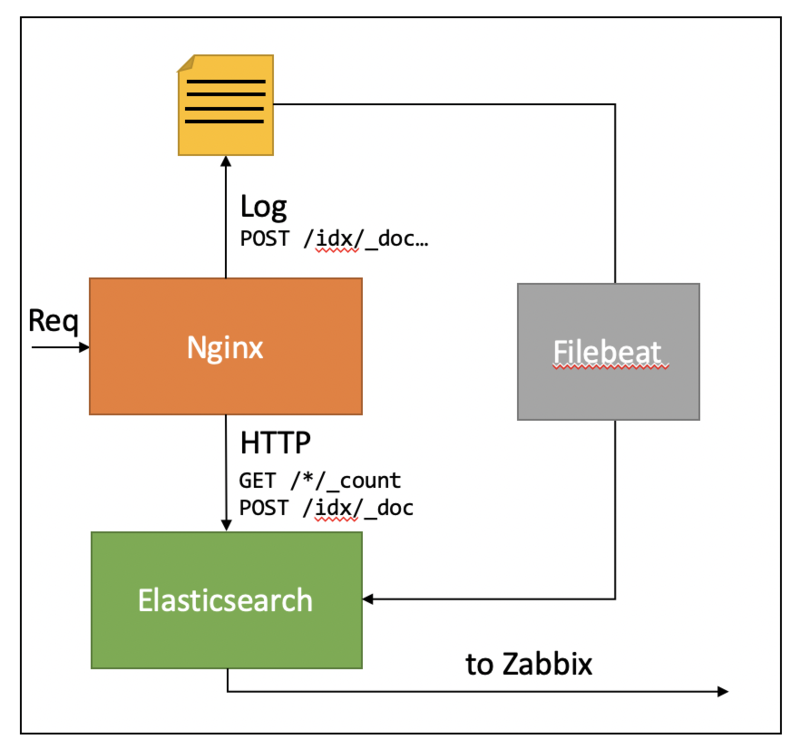
So we have all log records in Elasticsearch, and now we’d like to get the latency distribution in Zabbix as well. As a first step we create a shell script that can request the needed data.
Percentiles aggregation shell script
Using Elasticsearch’ HTTP API we can query Elasticsearch from the CLI using curl, e.g.:
For example, this query returns the 50 and 99 percentile for the nginx.access.request_time field. In general, we’d like to be a bit more flexible, so I created a script which lets you specify a query, the field, time range and index. Download that script and put it in /etc/zabbix/zabbix_agentd.conf.d:
Test it by invoking a query:
As you can see, it nicely outputs the various percentiles.
Create Zabbix UserParameters
The next step is creating a Zabbix UserParameter that can invoke this script. To do so, first create a user parameter file for Elasticsearch:
The elastic.percentiles name defines a key that we can use later when configuring Zabbix. Secondly, we need to enable UnsafeUserParameters in the Zabbix agent config since we need to use some characters from the unsafe list. If you’re not comfortable setting this, you can always create hard-coded UserParameters by filling in the parameters to the es-percentiles.sh script.
To change this setting edit /etc/zabbix/zabbix_agentd.conf in your favorite editor and change this line:
# UnsafeUserParameters=0
to:
UnsafeUserParameters=1
Now restart the Zabbix agent: systemctl restart zabbix-agent so it can pick up the config change and the new UserParameters.
Now that our agent is capable of serving the latency data, let’s create the items in Zabbix.
Create the Zabbix items
As you might have noticed in the previous step, the output of the elastic.percentiles[*] is JSON. This is not something you can graph directly in Zabbix since Zabbix will see it as text. Instead, we need to create dependent items. With a dependent item, you first create a “master” item, that contains the JSON, and then you define dependent items that extract the wanted data from the JSON.
In the Zabbix GUI, navigate to the host configuration section and create a new item. Configure it as follows:
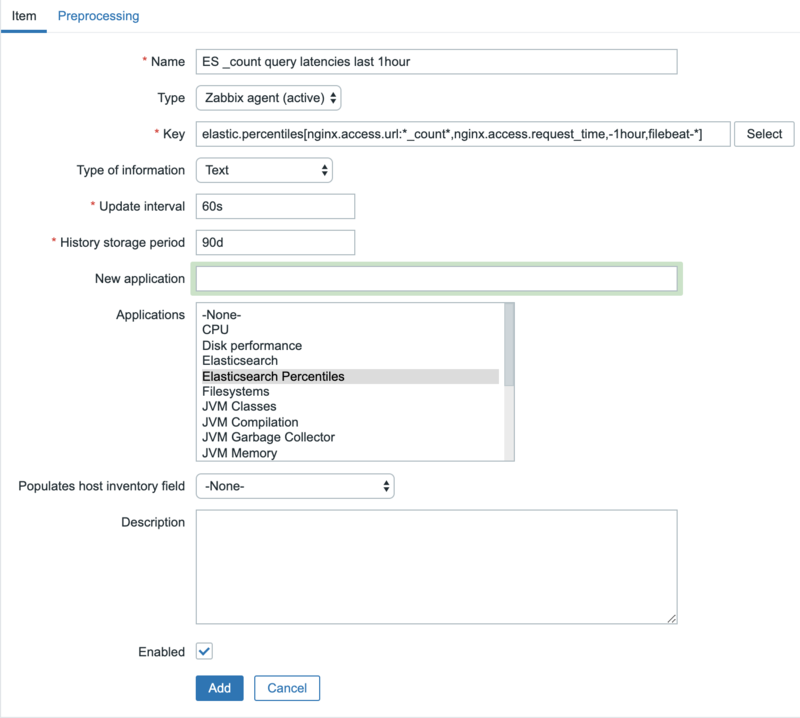
Specifically make sure Type of information is Text.
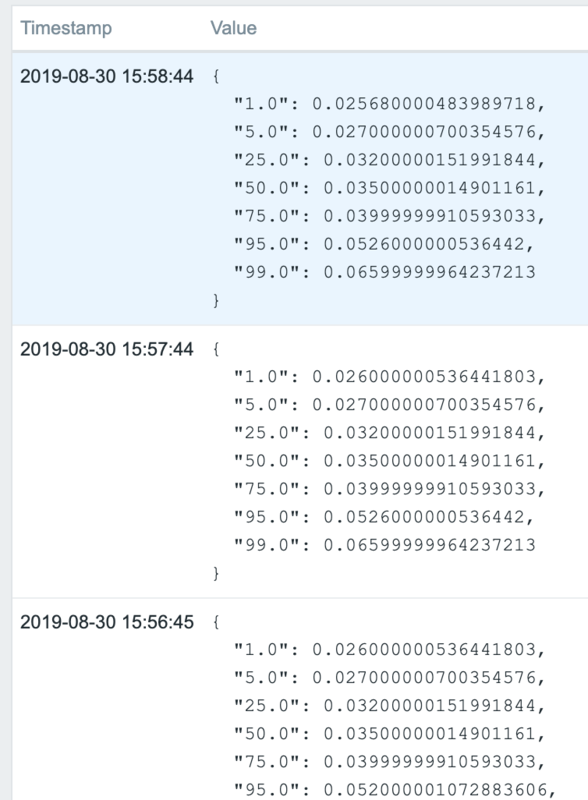
Give Zabbix a bit of time to pick up the changes, and you’ll see item data like the following appearing:
To actually make something we can graph and, we need to create a dependent item. First create the basic item:
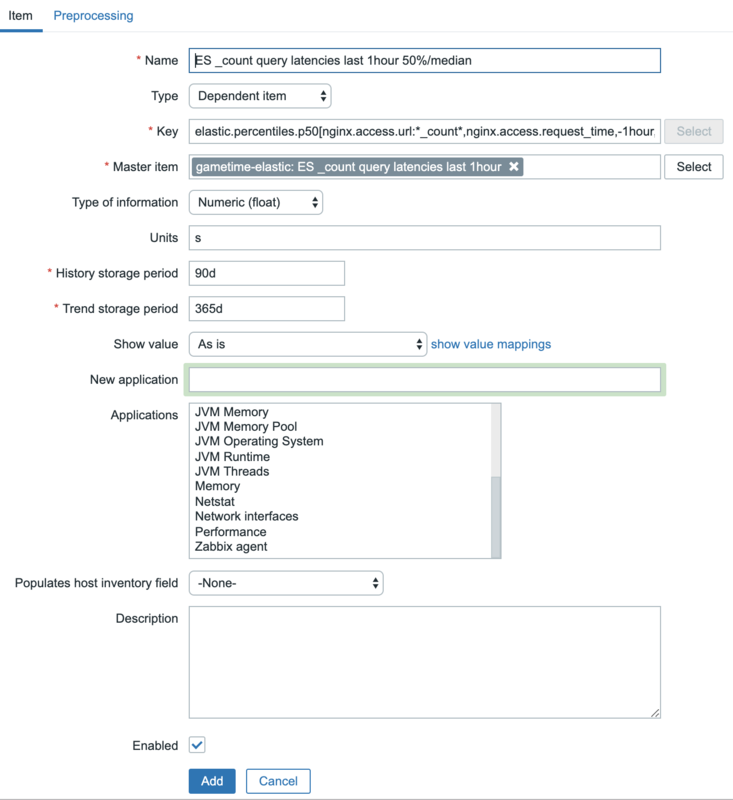
Note that you can pick a suitable key yourself. And then, in the Preprocessing tab, use JSON Path to extract the value:
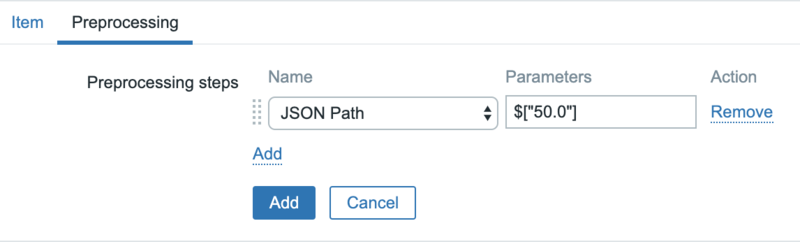
This picks the value at key 50.0 from the JSON, corresponding to the 50% percentile.
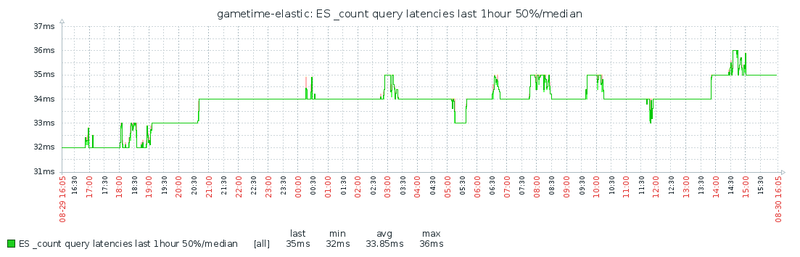
With that all set, you’ll see the data appearing:
Congratulations, you are now able to monitor request time percentiles for your HTTP requests in Zabbix. You can graph them, set triggers on them, or do whatever you like with them from Zabbix.
Unfortunately, the entire process of adding new queries is a bit tedious: you probably want to monitor multiple request types (e.g. _doc, _count, etc), and for every query you’d like to monitor several percentiles and probably create a graph. Doing this by hand is error-prone and boring. To make this a bit easier, we can use Zabbix Discovery, which is the topic of the final section of this post.
Using Discovery to populate the Zabbix hosts
Zabbix discovery is method to dynamically discover new data items on a host. We can leverage this to make it easy to monitor new queries. Using this method, we can define the various queries in a JSON file and Zabbix will automatically pick them up and create the items.
As a first step, create a new UserParameter on the Zabbix agent. We’ll put it in the same file we used before:
Secondly, we define our queries in the percentiles-discovery.json file:
This example defines four queries we’d like to monitor. You should recognize the arguments from the es-percentiles.sh script. Restart the Zabbix agent: systemctl restart zabbix-agent.
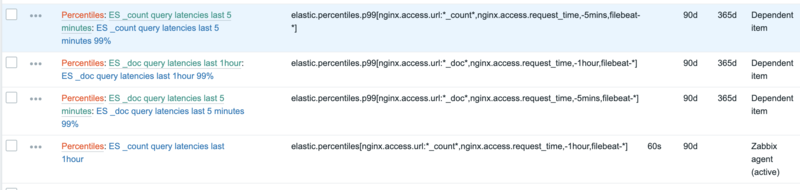
The next step would be to define the discovery items in Zabbix. To make things a bit easier though, I’ve created a Zabbix template for this for this. Import the template into your Zabbix and attach the template to your host. After a while, the discovered items will show up in your item list:
It will also automatically create a few graphs which contain the distribution of latencies (and are basically a copy of the graphs we used earlier in kibana):
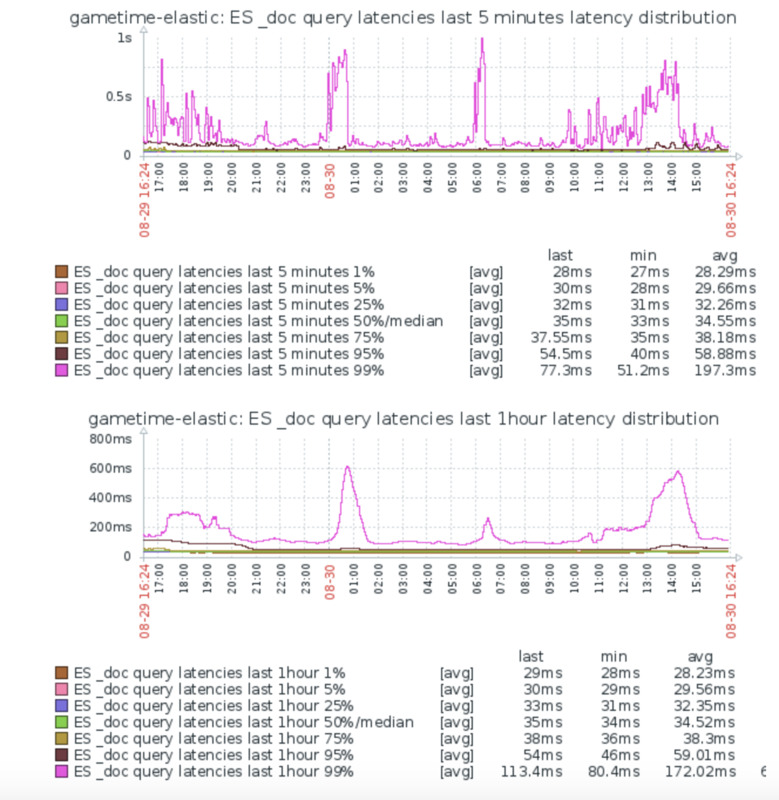
This shows we have some spikes in our 99% percentile, while the rest is fairly stable. Time to figure out what causes this!
Conclusion
In this post, I’ve used some fairly advanced techniques (some might call this hacks), to get the latency data into Zabbix. From this point onward, we can do things like set triggers so that we get notified if the data falls outside of certain thresholds.
As I said in the introduction, these techniques aren’t limited to monitoring Elasticsearch: you can use this for any web application or web site where you’d like to keep an eye on your request times.
In the next post, we’ll dive into monitoring the JVM to keep track of things like Garbage Collection; as it turns out this is a common cause of problems in Elasticsearch.